
a discovery of what anthropometry should be accommodated for passenger comfort in modern airline design
When’s the last time you’ve been in an airplane seat, crammed in the middle seat against two sweaty, coughing strangers and thought to yourself, “Man, have I gotten bigger or have these seats gotten smaller?” The answer is probably both! Since the early 2000’s, the width of airline seats has gotten significantly smaller. Combining this with an adult obesity rate of 41.7%, this is leading to a real problem with accommodation [1]. My thesis focused on the importance of designing around a variable human population in modern airline seating.
Duration
August 2022 - April 2024
OPEN Design Lab
Dr. Matt Parkinson
[1] Center for Disease Control, “Adult obesity facts,” https://www.cdc.gov/obesity/data/adult. html#print, 2022, accessed: (2023-04-05).
Skills
R Studio Data Analysis
Human Anthropometry
Accommodating Populations
Designing for Human Variability
Challenge:
GOAL: determine quantitative relationships between qualitative data points regarding perception of space through a whole lot of data.
My challenge was uncover relationships between comfort, accommodation, sufficiency, and acceptability of different experimental boundary conditions in order to provide design recommendations for the design of future airline seating. In short, find things out to make airline seating better for passengers.
The Process
Outcome:
DELIVERABLE: lots and lots of human data and a conclusion that shoulder width is the most important factor of accommodation in airline seating.
Nearly 900 lines of R Studio code analyzing anthropometric data of both participants and existing databases to narrow in on how people percieved the space around them. From my work, novel relationships between qualitative and quantitative points were unearthed, as well as the conclusion that using shoulder width as a metric for design in airline seating created better accommodation compared to using seated hip breadth for design in airline seating.
Throughout the course of the project, I tested 50 different human participants in a mock airplane seat apparatus to determine their perception of comfort, space acceptability, and space sufficiency based on their unique anthropometry. My thesis in particular focused on relationships between bideltoid breadth and comfort, rather than the usual seated hip breadth, when it came to personal space in airlines. Through the data gathered and R Studio analysis, the results were synthesized into a quantitative accommodation recommendation for qualitative things, providing a novel contribution to the field of ergonomics and design for human varibility.
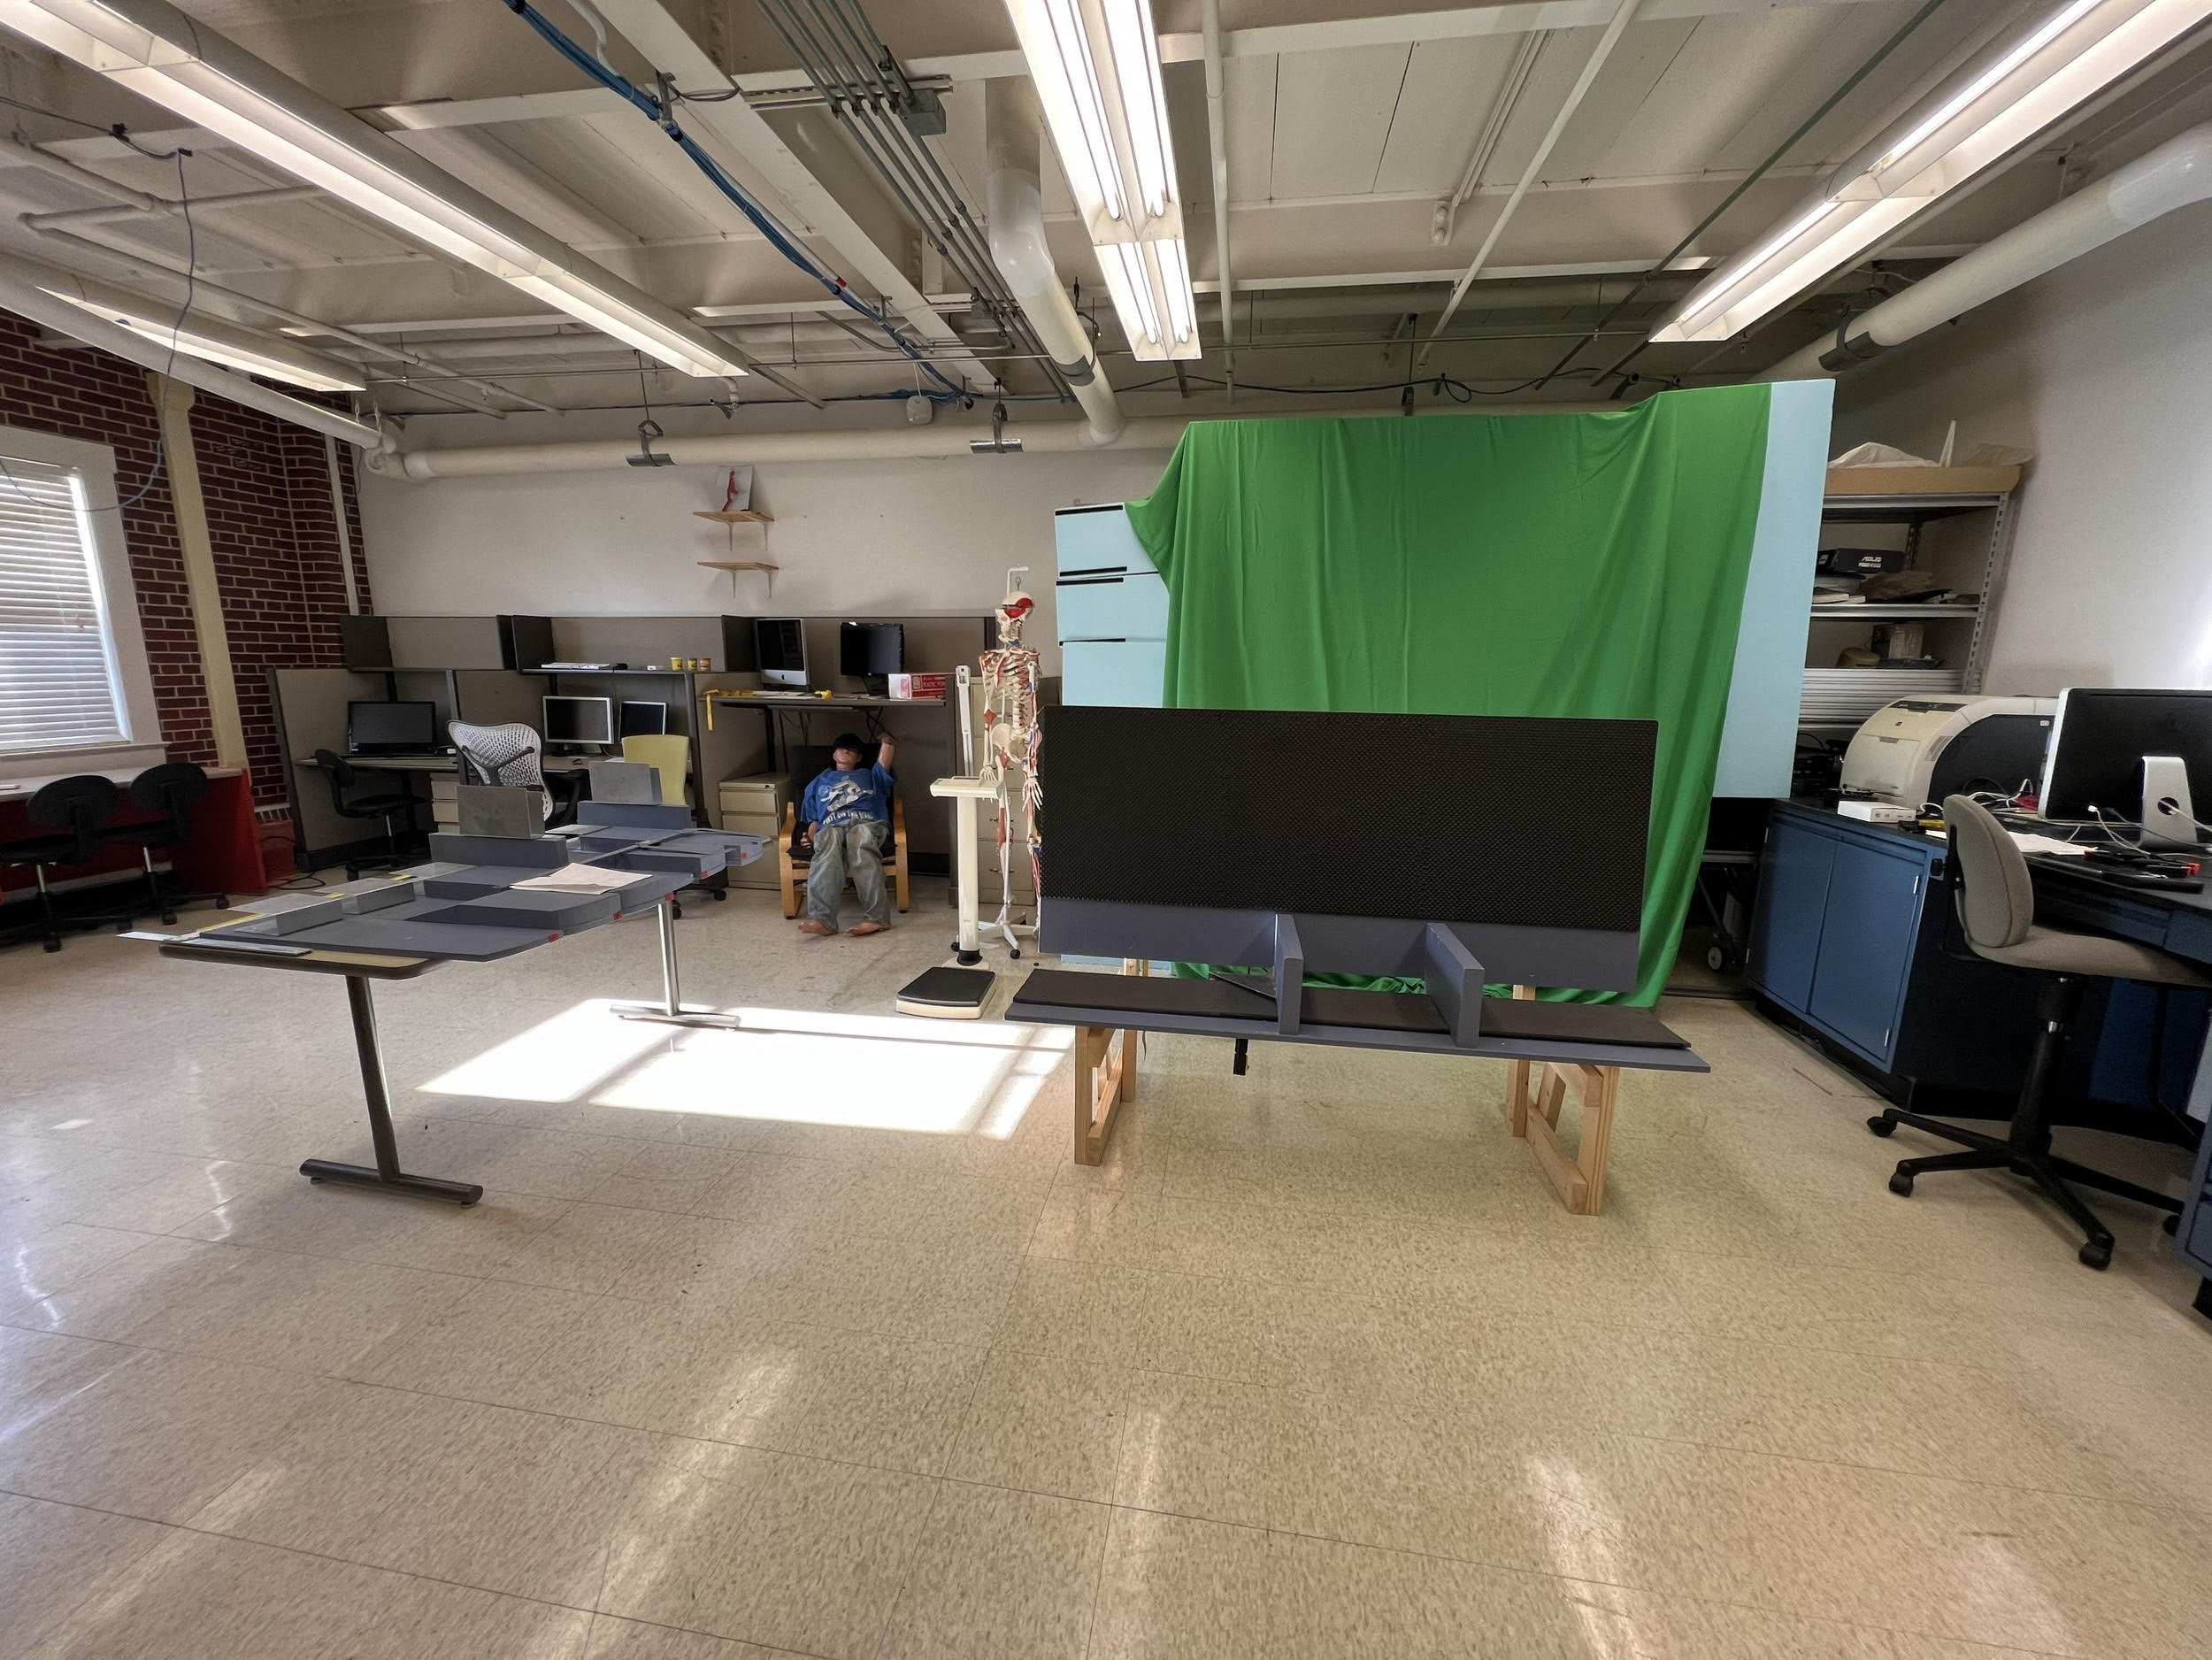
The big blue thing is an adjustable mock airline seat. Painted Delta Blue* of course!
*not affiliated with Delta Airlines, unfortunately. Would have been cool though.


Step 1: Recruitment
We recruited participants based on bins of stature and BMI. The more “average” participants’ bins were easily filled, but when it came to others, recruitment was difficult. More details on the bins below!

Step 2: Gathering Data
Gathering the participants was a long process, but testing them was the fun part. During this stage, we gathered anthropometric data with a variety of anthropometric tools on each participant as well as their perception of space sufficiency, acceptability, and comfort during all 35 trials.

Step 3: Send Help
This is where things really got dicey — it was time to actually make sense of this gigantic load of data I’d spent all this time gathering. Diving into R Studio was an exciting, but overwhelming part of the process.
Let’s zoom in
(find out more about the cool parts!)
-
Throughout the participant selection process, the goal was to find people with variations in stature and BMI to develop a well-rounded dataset. For both male and female participants, there were nine bins for each sex. The different groups for BMI were based on data from the Center for Disease Control (CDC), where a BMI under 25 is healthy, a BMI exceeding 35 falls into Class 2 (or Class 3) obesity, and the values between (25-30 and 30-35) fall into overweight and Class 1 obesity categories respectively. For the purposes of this study, no one was classified as “underweight.” Additionally, stature breakdowns were based on approximately the 25th and 75th percentile cutoffs for NHANES 2015-2018 data for both males and females.
-
When a participant arrives, they’re invited to take a seat if they would like, and then read over and sign a consent form. This consent form reiterates the importance of the study and the participant rights according to the Institutional Review Board (IRB). After signing the consent form and asking questions they may have, the MATLAB code is started and the trial begins. The following statement is read out loud to the participant:
This experiment will take no more than 45 minutes. At any point in the procedure, you may choose to end the experiment if you feel uncomfortable. If you are uncomfortable with the physical requirements of the task then you should not participate. We will use this data in future publications on ergonomics. Any reporting of the data will be completely anonymous. Feel free to ask questions at any time.
Next, the following general questions are asked regarding the participant:
• What is your gender?
• What is your age?
• What is your height (in.)?
• What is your weight (pounds)?
• What is your dominant hand?
• How many times do you fly per year?
Following this, the participant is told to remove their shoes and any coat or sweatshirt they may be wearing (which was likely in the cold Pennsylvania winters!) and is directed into the lab space where the following measurements will be taken (in millimeters or kilograms):
• Stature
• Mass
• Sitting height
• Seated hip breadth
• Bideltoid breadth
• Buttock-knee distance
The following statement is read:
Now we will move on to the next stage where you will be sitting in a model airplane seat. You will be given instructions to read that explain each part of the experiment. Please read these instructions carefully. Please sit in the airplane seat model. Throughout the experiment, the research assistant will be changing the seat width dimensions by moving the armrests side to side. After every new dimension, please complete the online survey. The questionnaire will be administered by a data collection platform on an iPad. This process will be repeated several times with different armrest positions controlling the width of the seat.
After the adjustment of the airplane seat apparatus for the first Trial 1, the participant is asked to take a seat and enter their responses to questions on the provided iPad and the experiment commences. After completing the trials, each participant recieved a crisp $20 bill.
-
Out of 35 MATLAB-randomized trials, the following breakdown occurred:
• 10 trials with no boundary conditions
• 16 trials with one sided boundary conditions
• 9 trials with two sided boundary conditions
In this experiment, the five trials at the beginning (1-5) with no boundary conditions are repeated at the end of the experiment (31-35) in a different order to determine the drift in a participant’s comfort rankings.
This experiment was designed to simulate real-life scenarios a passenger would experience in an airline seating through the use of physical boundary conditions.
There were 35 different experimental setups that were tested during each participant; not only did the width of the boundary change, but the physical boundary was also being altered with each trial. One-sided, two-sided, and human conditions were used. Below is a layout of all the different boundary conditions that were tested.

This setup featured no physical boundary condition of another passenger, but focused on the sole changing of the seat width. The seat widths were randomized in their order, but not selected for no reason at all! The seat widths were based off of seated hip breadth (the horizontal distance between the outside of the hips while a person is sitting with their knees together and at a 90 degree angle), bideltoid breadth (the maximum distance between a person’s upper arms with elbows at a 90 degree angle), and the standard measurement for seat width in airplanes (432mm).
Conditions for seat width included: Seated hip breadth (SHB), SHB +/-25mm, SHB +50mm, Bideltoid breadth, 432mm

A

B

C

D

G

H

N

I

O

J

P

E

K

F

L

Conditions A and G represent just another person to one side of you - there’s no interaction with them touching your shoulders or body.
Conditions B and H indicate a sole intereference of the shoulder interaction between passengers, C and I represent a passenger fully interacting with another passenger on one side, and D and J are creating some frustrating armrest hogging.
Finally, Conditions E, F, K, and L are our human boundary conditions. My research assistant and I (hi Luke!) did this to determine real person-person space perceptions & interactions.
M
Our two-sided boundary conditions are just like what they sound like — representative scenarios of different passenger-passenger interactions, but this time with our participant sitting in the dreaded middle seat.
When I first started doing research in my lab, I didn’t know what the scope of my thesis would be besides just accommodation in airlines. As human trials went farther along, I noticed a common thread of the shoulder-related trials being particularly uncomfortable.
Bideltoid breadth became my area of interest after noticing passengers being physically uncomfortable in the seat as well as verbally saying how much they hated certain conditions.
One-Sided Boundary Conditions
Two-Sided Boundary Conditions
What questions did we ask?
Below is a screenshot of the MATLAB code output. Our participants were given an iPad with this display on it and asked to answer the questions on the seat width and the amount of space they had, as well as a slider at the bottom detailing their overall comfort. Although the code was made by someone the year prior, I was able to help edit certain things from the pilot trials.


A closer look: why bideltoid breadth?
After noticing the obvious discomfort when it came to shoulders being disaccommodated, I wanted to do a closer look into the data. Using the ANSUR II database of military personnel, I wanted to see the the probability density of bideltoid breadth and seated hip breadth for the male and female populations in this data set.
The data indeed confirmed my observation, not only for males, but for females, which I didn’t initially expect. This is where I not only narrowed in on my project scope for the written thesis, but where I fell in love with making sense of the data I had been collecting for over a year as a part of this lab.
I was especially interested in this because of my passion for lifting. Some gym friends of mine, male and female, participated in the trials and I noticed even higher levels of discomfort!

When it comes to space sufficiency of a human boundary condition (another passenger), most people said the space was either insufficient or barely sufficient.
Key Takeaways
In the trials where bideltoid breadth exceeded the seat width, both space acceptability and space sufficiency were generally ranked as very unacceptable and very insufficient.
With airlines increasing their load factor, passengers are more likely to sit next to others, leading to higher levels of stress and a lower sense of well-being
The highest average comfort rating occurs when the bideltoid breadth equals the seat width, indicating a key focal point for design in future airline seating to increase passenger comfort and accommodation.
In these cases, the comfort level was also the lowest when combined with two-sided boundary conditions. This is a load
Although a 90% accommodation level is met with a seat width of 544mm (with a modern seat width of 432mm), this may not be realistic given the airline desire for increased load factor.
The Participant Pool
Although Penn State University is a relatively diverse campus, it is a predominantly white campus and our participant pool reflects this. However, since race and ethnicity are not body shape/size predictors like gender is, those breakdowns were not included in the study.
Age Range
With a mean age of 23.6 years old, this study was clearly conducted on a college campus. Although age isn’t a predictor of anthropometry like gender is, age-related preferences may have occurred.
Experience Levels
Although a question was asked about the frequency someone travels via airplane, this was not included in the data analysis for this thesis. However, those who travel more often had a different sensitivity to trials; some shrugged off trials that others were squeamish about!
The Bins
The bins (groups of participants based on stature and BMI) that I mentioned before provided valuable data, but with some bins either unfilled or untouched, there is still more data that could be gathered. The untouched bins included the shortest stature for males and females with a BMI of >35.
ANSUR II vs. This Thesis
ANSUR II, a large anthropometry database of military personnel, conducted research a bit differently. The most notable difference in the testing procedure is the wearing of tight-fitting clothes. For my thesis, I ensured that pockets were emptied and shoes and sweatshirts were taken off, but with no streamlined outfit, those differences should be noted.
Other Variations
This study went on for about a year and a half. After doing research for one year, Luke (the one in the boundary condition photos) graduated and the remaining trials were completed by graduate students who got involved to help complete the research.
Future Work
Although a very dense set of data were gathered, improvements and expansions of the study could certainly be made. One consideration would be to increase the time in the human boundary conditions to be more representative of a real-life travel scenario. More future work for this study could include a broader dataset of individuals, lifetime of the seat size, and considering adjustability as an aspect for increasing accommodation. Designing for human variabilty can only be achieved through considerate design practices and a multivariate approach using human anthropometry.


Acknowledgements!
This thesis and research would not have been possible without the incredible Dr. Matt Parkinson and his constant guidance and insights. Thanks for giving me my why engineering. Also, huge thanks to Luke, Ming-Hua, and Shelby, without whom this study wouldn't have been possible! And finally, to Tough Kelly the Test Dummy, for always being there to listen when I couldn’t figure out R code.